Hablemos de la diafonía, la precisión y la exactitud del sensor de fuerza/torque multieje.
The common crosstalk is 2%~5% of the full scale, and the 1%FS of the full scale is excellent. The crosstalk index is used to measure the coupling effect between the measurement directions of the multi-dimensional force sensor, which can reflect the measurement error level. This index is one of the key indicators reflecting the product performance. So what is crosstalk?
Look at this table.
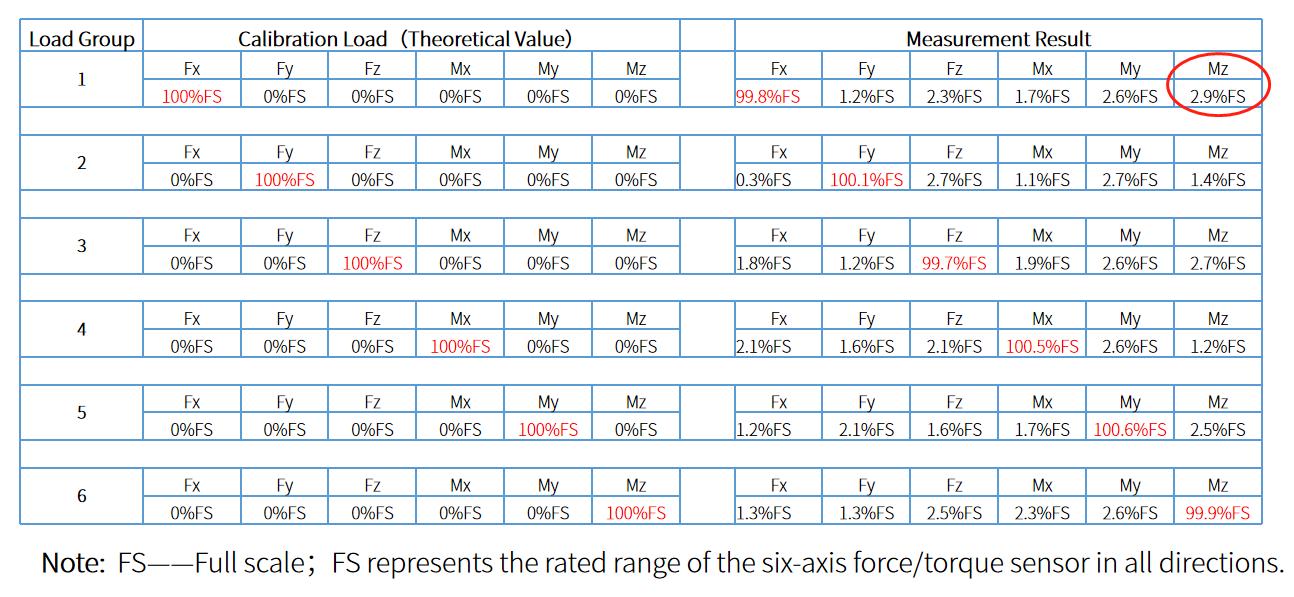
This is a table made of the measurement results obtained by accurately loading the six measurement directions of the transducer to their respective rated loads.
It can be seen from the load group 1 of the theoretical value that the Fx value is 100%FS of the full scale and other directions are all 0%FS, the reason for this phenomenon is that only the Fx direction is loaded to the rated load(the loading direction and load value are assumed to be very accurate). But from the load group 1 of the measurement result, we can see the measurement results of Fy, Fz, Mx, My, Mz are crosstalk under the action of Fx. The measurement results from Fy to Mz reflect the coupling disturbance of Fx to the other five measurement directions.
Similarly, the measurement results in load group 2 to 6 reflect the coupling disturbance caused by Fy, Fz, Mx, My and Mz on other measurement directions when loaded separately.
The multi axis load cell manufacturers often choose the maximum crosstalk value in the table as the crosstalk index. For example, 2.9% in this table is the maximum crosstalk result, you write ‘ crosstalk≤3% of full scale’ in the product manual.
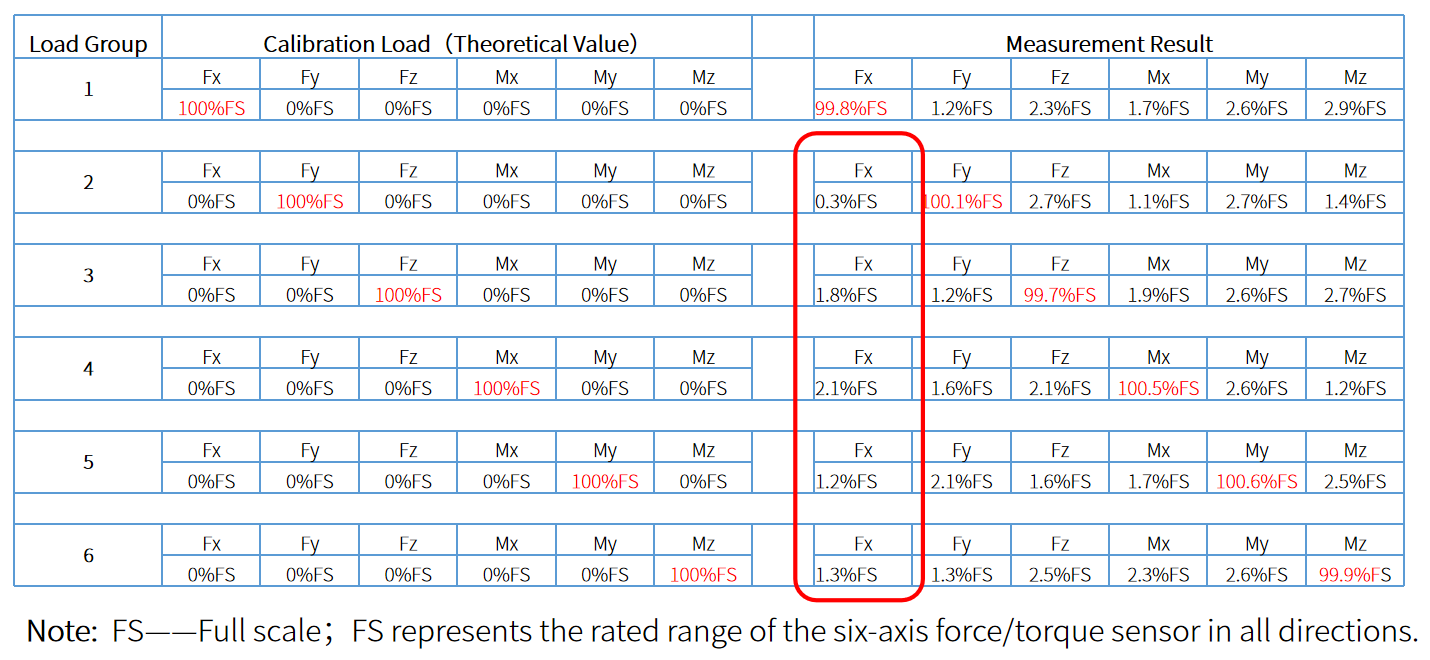
Do you know if the Fx direction is not loaded and other five directions are loaded to 100%FS of the full range, will the output of Fx is the superposition of the crosstalk results in the other five directions? Is this the superposition of the results of the load group 2-6 of the measurement result from this table?
Our experience is that the output of Fx at this time, the probability is not the other five directions of Fx crosstalk results superimposed. However, the output of Fx is often larger than the crosstalk index in the product manual.
It can be seen from the introduction that the crosstalk index of the transducer can only roughly indicate the coupling interference of the product. In order to accurately describe the measurement error level of the 6 axis load cell, we recommend the two indicators of precision and accuracy.
Precision means the repeatability between measurement results. Its verification method is to load the same set of repeated loads in multiple times and directions under the same environmental conditions and within the rated load range, and then calculate the standard deviation of measured value and divide it by the range.
Accuracy means the degree of deviation between the measurement results and the theoretical value. The method obtained is to perform multiple multi-directional joint loading on the sensor, calculate the standard deviation between the measured value of the sensor and the theoretical value of the applied load, and then divide the range.
In the verification process of precision and accuracy, it is necessary to jointly load the multi-axis force torque transducer according to its highest measurement dimension. For example, for a six axis force load cell, each test load must be a random combination of Fx, Fy, Fz, Mx, My and Mz. The precision and accuracy obtained in this way can clearly evaluate the measurement error level of each measurement direction of the sensor within the range, which is more practical than the crosstalk index. If the accuracy of the transducer is better than the full range of 0.5 % FS, for the measurement results of Fx, no matter what proportion and absolute value of Fy, Fz, Mx, My and Mz interfere with Fx in the measurement process, the deviation between the measurement results of Fx and the theoretical true value is within the full range of 0.5 % FS. The same is true for the other five directions. Accuracy actually covers the hysteresis, linearity, creep and other error factors, which can better reflect the overall performance of the product. It is one of the most core technical indicators of multi-axis force/ torque sensor.
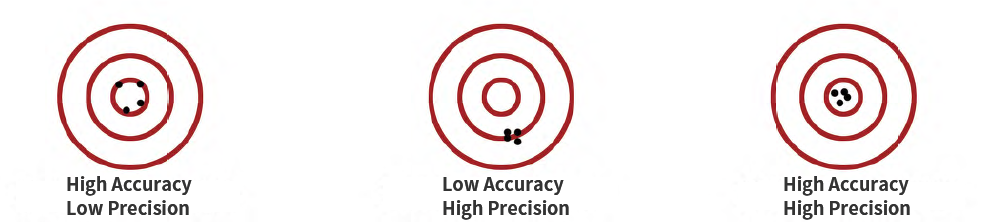
In order to more vividly illustrate the statistical significance of precision and accuracy. We can see this figure, assuming that the theoretical truth value is the center of the ring, and the black dot represents the measured value. The figure on the left can be seen to be high accuracy and low precision. In the middle of this diagram can be seen is low accuracy, high precision. The figure on the right can be seen to be high accuracy and high precision.
This is the whole content of this period. If you want a high-quality force measurement scheme, please pay attention to Kunwei Technology. See you next time.
.jpg)